Our Blog
But it is more popular for project managers. Agile software projects outnumber waterfall projects by nearly two-to-one.[i] [ii] Is it performing as promised? Based on data from ITDashboard.gov, not quite.
Agile projects are also behind schedule
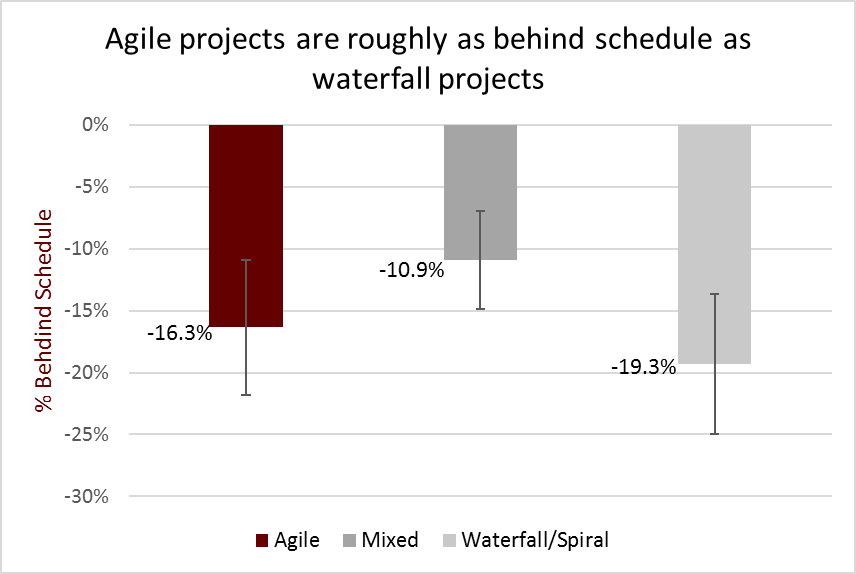
Figure 1: Comparing schedule variances between federal software projects. Average variances with a 95% confidence interval shown. Data from ITDashboard.gov
On average, federal software projects are 16% behind schedule. Agile projects match this average, while waterfall projects are 19% behind schedule. But because of the wide range of schedule variances, this difference could be due to chance.
Agile projects are 37 days behind schedule and Waterfall/Spiral projects are 57 days behind. This 20-day difference is what OMB found in 2014 and hasn’t changed in the past two years. It could be because duration metrics still don’t reflect agile development.
These numbers don’t tell the whole story. 70% of federal software projects are on or ahead of schedule. 868 (73%) of the 1193 Agile projects are on-time, compared to 68% (309 / 456) of Mixed projects and 65% (427 / 662) for Waterfall/Spiral.
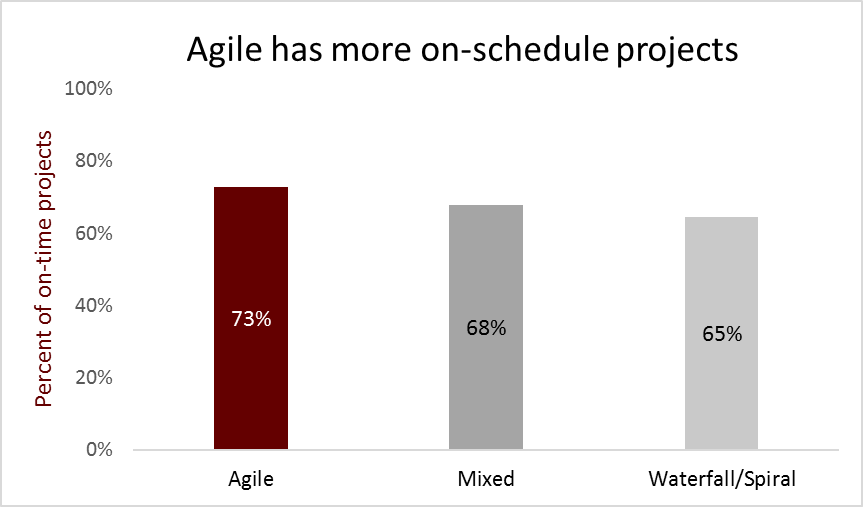
Figure 2: Comparing projects on or ahead of schedule (as percent of total) between project management approaches. Data from ITDashboard.gov.
So, most projects are on or ahead of schedule. The projects behind schedule are in the minority. But, these are significantly behind schedule. This brings down the average schedule variances for each methodology.
Agile projects are also over budget
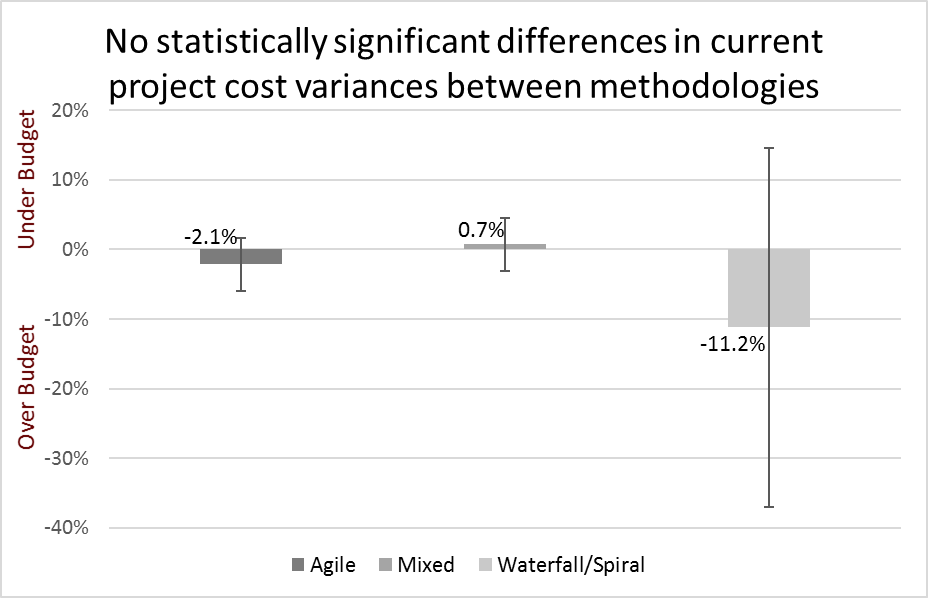
Figure 3: Comparing cost variances between federal IT projects. Average cost variances (percentage) with a 95% confidence interval shown. Data from ITDashboard.gov.
Federal software projects, on average, are 4% over budget. Agile projects are 2% over budget and Waterfall projects are 11% over (on average). This is a sizeable difference, but not statistically significant.
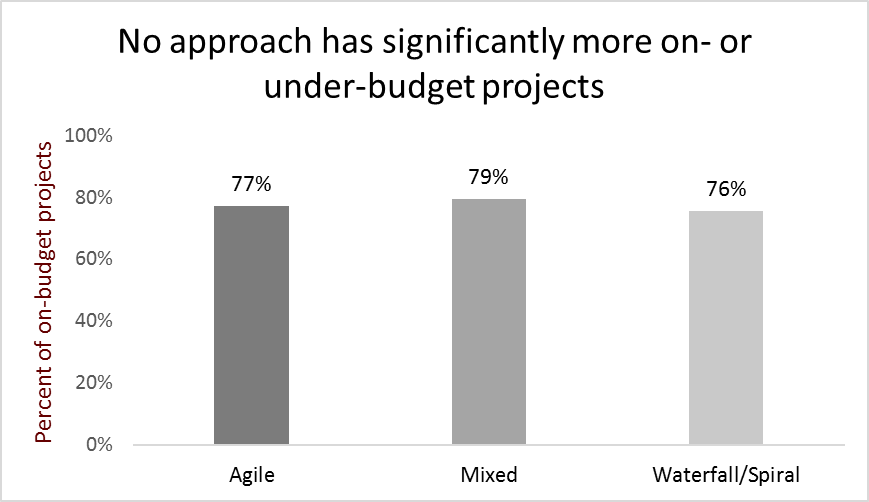
Figure 4: On-budget projects (zero or positive cost variance) as a percent of total projects. Data from ITDashboard.gov.
77% of all federal software projects are on or under budget. Unlike with schedule variances, ITDashboard.gov data doesn’t show major differences in cost variances between methodologies. 919 (77%) of the 1193 Agile projects are on- or under-budget. This is similar, percent-wise, for Mixed (362 of 456) and Waterfall/Spiral (500 of 662) projects.
More agile investments are rated riskier
Federal IT investments are typically comprised of at least one project. Federal Chief Information Officers (CIOs) rate each IT investment on its ability to meet its goals. These CIO evaluations are scored from 1 to 5; lower scores mean a higher risk of failure.
Interestingly, CIOs rate more agile investments[iii] as riskier than their counterparts. Investments with a higher percent of agile projects tend to see a few more doubts from CIOs. Comparatively, investments with mostly mixed or waterfall/spiral projects tend to be viewed as more likely to succeed.
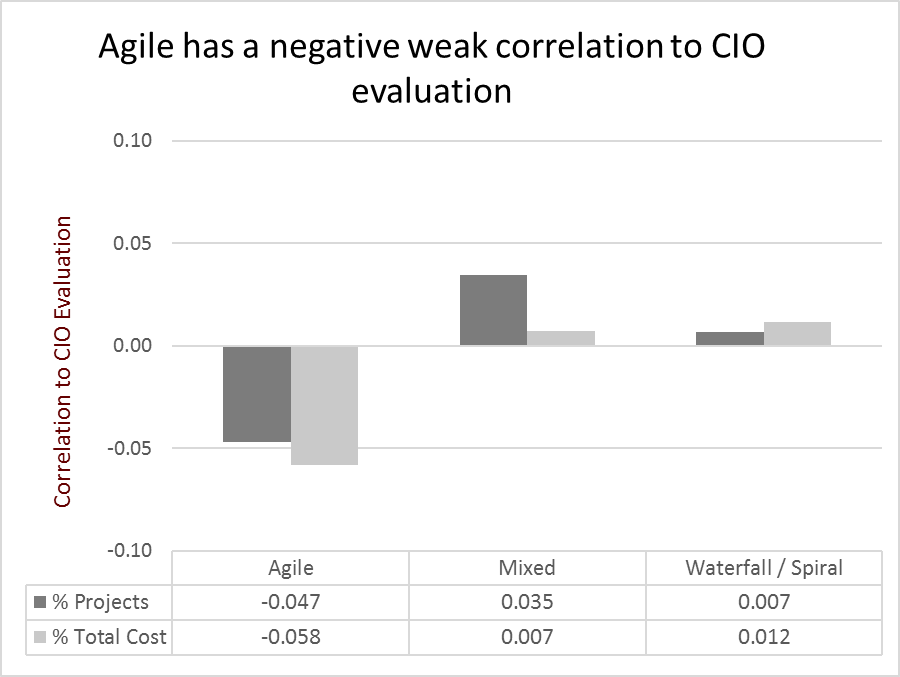
Figure 5: Correlation between project management approaches and CIO evaluation of IT investment. Falls into a category if >50% of projects (or project cost) relate to that category. Data from ITDashboard.gov.
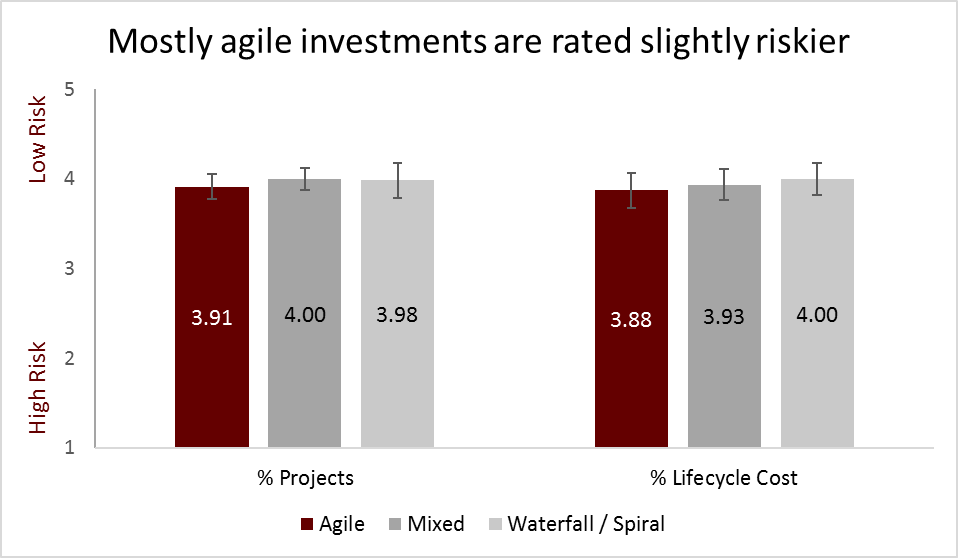
Figure 6: Comparing average CIO evaluations between IT investments. Falls into a category if >50% of projects (or project cost) relate to that category. 95% confidence intervals shown. Data from ITDashboard.gov. CIO evaluations are on a scale from 1 to 5.
GAO noted that federal CIOs under-rated risk in 63% of the IT investments analyzed. Our analysis shows that IT investments hover around a 4 out of 5 (or Medium-Low) for risk. The numbers in Figure 6 may be lower (i.e. investments are riskier) if we consider the GAO’s findings.
Unlike with cost or schedule variances, agile investments underperform waterfall investments in project risk. Again, this difference between agile and waterfall isn’t statistically significant.
The graphs above show some disparity in performance between federal agile and waterfall projects. But this difference isn’t statistically significant. The federal government seems to struggle with agile project management. Several agencies will continue to focus on agile, including DHS.
Agile is a small improvement over traditional approaches, in terms of cost and schedule metrics. There’s still a lot of work to be done to get federal software projects on track, no matter the method used.
Methodology
We went to the data feeds of the ITDashboard.gov site and downloaded current (FY17) “Project” and “Business Case” data for all agencies. The Business Case feed details federal IT investment performance. Each investment may have multiple projects. Data was matched by Unique Investment Identifier (UII) to identify which software development lifecycle (SDLC) approach each investment uses.
Projects marked as “Agile” or “Iterative/Prototype” were grouped into a general “Agile” SLDC bucket. Similarly, “Waterfall” and “Spiral” projects were designated as “Waterfall/Spiral”. If a project has “N/A” or a blank for its SDLC, it is not counted as a federal software project.
Arithmetic means and 95% confidence intervals for cost and schedule percent variances were computed for each SDLC bucket based on project data. Arithmetic means and 95% confidence intervals for CIO evaluations were calculated for each SDLC bucket for IT investments from the IT Portfolio data.
Dummy variables in the project data were created for each SDLC bucket, plus an “Other” bucket, denoting which projects fell into that category. Project lifecycle costs were multiplied by these dummy variables. Projects were grouped by their UII and the percent of Agile projects, as well as the percent of project lifecycle cost spent on Agile projects, were calculated for each UII.
[i] Source: ITDashboard.gov. There are approximately 4,500 federal IT projects listed. Of those, 2,080 either don’t have a methodology listed (mostly maintenance projects) or a software project management methodology is not applicable .
[ii] http://www.gao.gov/products/GAO-12-681
[iii] Federal IT investments are generally comprised of at least one project. Each project may use a different methodology. This analysis classifies an investment as “agile” if over 50% of the projects (or project lifecycle cost) that make up that investment use an agile SDLC.
Greg Reger is a Senior Associate who connects the dots between data, processes, and people to enhance public services. He has dedicated his career to make government work better.
Icon by Jeremy J Bristol from Noun Project