Our Blog

If you’ve read magazines like US Weekly or People, you’ve seen the “Who Wore It Best” section. Readers are asked to compare two celebrities who wore the same outfit and judge who pulled it off. Being the project management nerds that we are, we looked at ITDashboard.gov data to see which federal agencies make agile project management work for them.
Going Big or Going Home
Six of the 26 federal agencies in the ITDashboard.gov data spend over 50% on agile projects. Two agencies, the Nuclear Regulatory Commission and the Veteran’s Administration (VA), have agile projects that make up over 70% of all their project lifecycle costs. They also use an agile or iterative project management method for over 50% of all their projects.
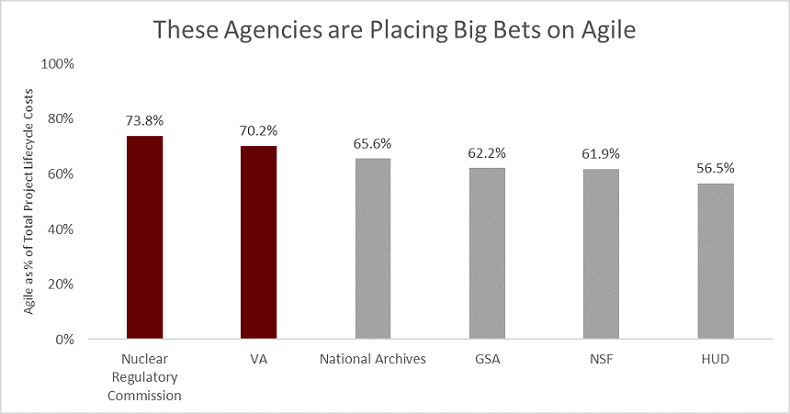
Figure 1: Percent spend on agile projects. Computed as the sum of agile/iterative project lifecycle costs divided by the sum of all project lifecycle costs for that agency. Data from ITDashboard.gov.
Veterans Affairs has 489 IT projects, totaling over $12 billion in project lifecycle costs. 246 (50.3%) of these projects are using an agile or iterative project management method, totaling $8.7 billion. The Department of Housing and Urban Development (HUD) has 21 IT projects in the pipeline; 10 are agile. These ten projects represent 56.5% ($100M of $177M) of their total IT project lifecycle costs.
Getting It Done…
There is some big money going into agile projects from these agencies. All but two of the 26 agencies are spending at least $20M on agile projects. Some agencies are better at agile project management than others.
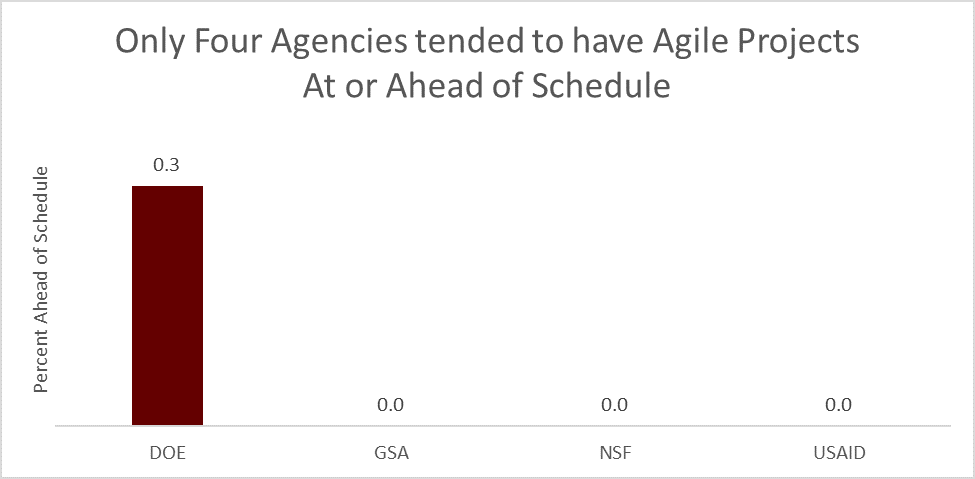
Figure 2: Comparing average schedule variances (%) for agile/iterative. Only agencies with positive average schedule variances shown. Data from ITDashboard.gov.
Looking just at agile or iterative IT projects, only four agencies had an average schedule variance at or above zero. In other words, these four agencies tended to have agile projects on or ahead of schedule. The agile IT projects at other agencies were often behind schedule, up to 130% behind schedule. Our previous analysis found that on average, agile projects are 16% behind schedule.
With Budget to Spare
20 of the 26 agencies saw the average agile or iterative project within budget. Agile projects at two agencies are more than 10 percent under budget. At the Department of Agriculture, agile projects are more than 18% under budget. Comparatively, their other IT projects tended to be only 1.4% under budget.
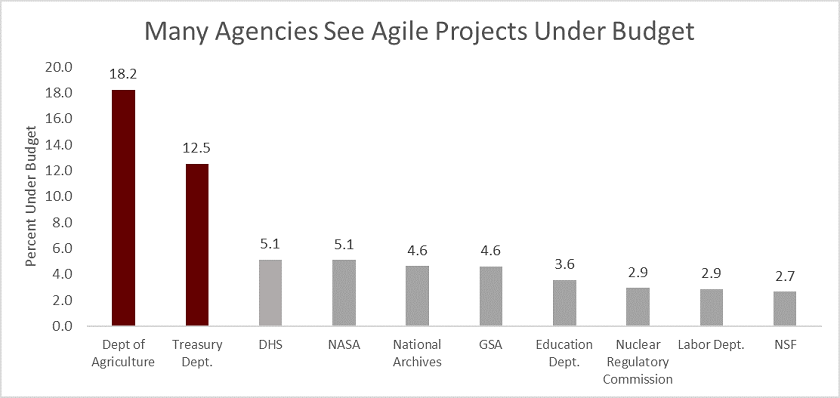
Figure 3: Average cost variances for agile projects. Only showing top ten cost variances. Data from ITDashboard.gov.
It’s great to see agile IT projects under budget at so many agencies. Some agencies only have a few agile projects. For example, three of NASA’s 29 IT projects use an agile or iterative methodology.
Some agencies are struggling more with agile than other project management methods. At the Department of Transportation (DOT), 7% (16 of 240) of their IT projects are agile or iterative. Non-agile IT projects at DOT are 2.8% under budget and 38% behind schedule. Their agile IT projects are 12.6% over budget and 130% behind schedule on average.
Comparing Quality
Each IT investment, which is typically comprised of at least one IT project, often has performance metrics beyond cost or budget to gauge success. Such metrics include the number of registered users, system availability, cases processed on-time, and cost per support hour. The median federal IT investment has seven performance metrics.
Federal agencies define their metrics and target values. ITDashboard.gov data shows whether each metric met its target. Agile projects met performance targets 78.7% of the time. Other IT projects met their goals 80.1% of the time.
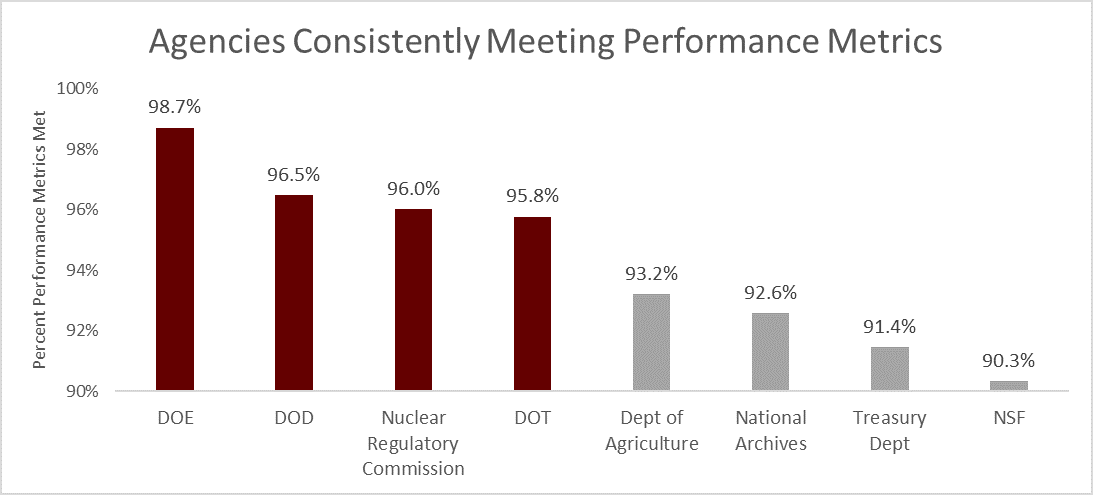
Figure 4: Average percent of performance metrics met for agile/iterative IT projects. Displaying agencies meeting performance metrics over 90% of the time. Data from ITDashboard.gov.
Agile/iterative projects in eight agencies achieved performance goals over 90% of the time. All other IT projects at these agencies met their performance goals less often, ranging from 69% at National Science Foundation (NSF) to 94.2% at the Nuclear Regulatory Commission.
Who Does It Best?
There are some common agencies featured on these four graphs. The National Archives and Records Administration (National Archives) and Nuclear Regulatory Commission both spend a large percentage on agile projects, which are often on budget and meet performance metrics targets. However, their agile projects have trouble keeping to the schedule.
The General Services Administration (GSA) spends a large percentage on agile projects, which are usually on time and on budget. The agile projects at these agencies meet their target metrics roughly 82% of the time.
The Department of Energy (DOE) is also usually seen among the top performers. The DOE doesn’t put a high percentage of IT dollars into agile projects. However, their agile projects are usually on time, on budget, and meet performance metrics over 90% of the time.
The agency present in all four graphs is the NSF. Half of their IT projects use an agile or iterative project management methodology, which makes up 61.9% ($83M of $134M) of their total project lifecycle costs. NSF’s IT projects (both agile and non-agile) are right on schedule and 2.7% under budget. Their agile projects meet performance targets 90.3% of the time, 21.3 percentage points higher than all their other IT projects.
What are your thoughts? Which agency do you think does agile best?
Can We Call It a Comeback?
We first started this analysis at the end of April, pulling data that hadn’t been updated since August 26, 2016. Our original write-up saw what looked to be a four-way tie between NSF, USAID, DOE, and National Archives. Each of these agencies was a top performer in three of the four categories. It was quite dramatic.
After re-checking the data before we were about to publish this post, we realized ITDashboard.gov had been updated. Now, our most recent update is from June 7, 2017. This changed everything.
The VA is now spending significantly more on agile projects than in the past (from 55% to 70% of total project lifecycle costs). The Labor Department is now spending less than 50%. The Environmental Protection Agency (EPA) now sees agile project behind, not ahead of, schedule. Two agencies, the Department of Defense (DOD) and HUD, are now experiencing agile projects over budget (on average). Agile projects at the Social Security Administration (SSA) are meeting their performance targets 87.5% of the time, down from their leading 97.5%.
USAID used to be a strong contender, but agile projects now make up 45% of their total project lifecycle costs, down from 51%. The Commerce Department seems to be facing recent struggles with their agile projects. These projects used to be 4.1% under budget and meet performance targets 91% of the time. Now it’s only 1.3% under budget and 85% met.
In a competition, when one entity slips another succeeds. The Department of Agriculture is now among the top performers in both meeting performance targets and being under budget with their agile projects. The Nuclear Regulatory Commission pumped more dollars into agile projects, making it tied for second place. NSF improved the percent of times its agile projects are meeting performance targets, thus edging it to the top performer list in all four categories.
The underdog agency in our analysis was GSA. They’ve been throwing hundreds of millions of dollars into agile projects, but these projects tended to struggle. Now, their agile projects are usually under budget and right on schedule. This pushed GSA to tie with National Archives, Nuclear Regulatory Commission, and the DOE, in being a top performer in three of the four categories.
Methodology
We went to the data feeds of the ITDashboard.gov site and downloaded current (as of June 9th, 2017) “Project”, “Performance Metrics”, and “Performance Metrics Actuals” data for all agencies. Projects marked as “Agile” or “Iterative/Prototype” were grouped into a general “Agile” software development lifecycle (SLDC) bucket.
Dummy variables in the project data were created for “Agile” and “All Other” project types. Project lifecycle costs were multiplied by these dummy variables. The percent of Agile projects, as well as the percent of project lifecycle cost spent on Agile projects, were calculated for each agency. Arithmetic means for cost and schedule percent variances were computed for each agency based on project data for agile projects.
We matched Unique Investment Identifiers from both “Project” and “Actual Performance” datasets to grab the percent of times where the project met their performance targets (‘average percent met’). The ‘average percent met’ was then averaged for “Agile” and “All Other” projects for each federal agency.
Greg Reger is a Senior Associate who connects the dots between data, processes, and people to enhance public services. He has dedicated his career to make government work better.
Icon by Creative Stall from the Noun Project